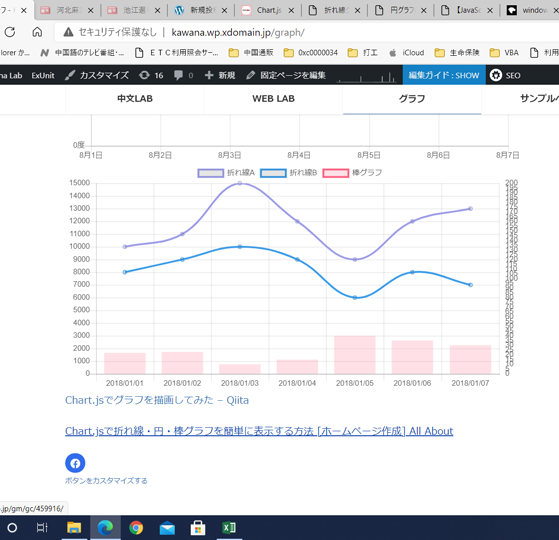
折れ線と棒グラフの複合グラフを作成する。
Chart.jsを使って複数の折れ線グラフ+棒グラフを表示する – Qiita
<script src="https://cdnjs.cloudflare.com/ajax/libs/Chart.js/2.7.2/Chart.min.js"></script>


    <canvas id="myChart"></canvas>
    <script type="text/javascript">
        var ctx = document.getElementById('myChart').getContext('2d');
        var myChart = new Chart(ctx, {
            type: 'bar',
            data: {
                labels: ['2018/01/01', '2018/01/02', '2018/01/03', '2018/01/04', '2018/01/05', '2018/01/06', '2018/01/07'],
                datasets: [{
                    label: '折れ線A',
                    type: "line",
                    fill: false,
                    data: [10000, 11000, 15000, 12000, 9000, 12000, 13000],
                    borderColor: "rgb(154, 162, 235)",
                    yAxisID: "y-axis-1",
                }, {
                    label: '折れ線B',
                    type: "line",
                    fill: false,
                    data: [8000, 9000, 10000, 9000, 6000, 8000, 7000],
                    borderColor: "rgb(54, 162, 235)",
                    yAxisID: "y-axis-1",
                }, {
                    label: '棒グラフ',
                    data: [22, 23, 10, 15, 40, 35, 30],
                    borderColor: "rgb(255, 99, 132)",
                    backgroundColor: "rgba(255, 99, 132, 0.2)",
                    yAxisID: "y-axis-2",
                }]
            },
            options: {
                tooltips: {
                    mode: 'nearest',
                    intersect: false,
                },
                responsive: true,
                scales: {
                    yAxes: [{
                        id: "y-axis-1",
                        type: "linear",
                        position: "left",
                        ticks: {
                            max: 15000,
                            min: 0,
                            stepSize: 1000
                        },
                    }, {
                        id: "y-axis-2",
                        type: "linear",
                        position: "right",
                        ticks: {
                            max: 200,
                            min: 0,
                            stepSize: 5
                        },
                        gridLines: {
                            drawOnChartArea: false,
                        },
                    }],
                },
            }
        });

    </script>
コメント